Publishers Dashboard
Using Dashboard
Welcome to our advertising portal!
How to navigate the new user interface:
Let’s get started by understanding how to navigate within the user interface. Once you login, you will land at the “Dashboard” page.
The Dashboard describes the following section:
- Sites & Apps Overview
Sites & Apps Overview displays the details about the revenue earned by the publishers for Today, Yesterday, This month and Last Month. It also displays the Credit Balance. For new publishers, the data is empty and only for the existing publishers details are displayed.
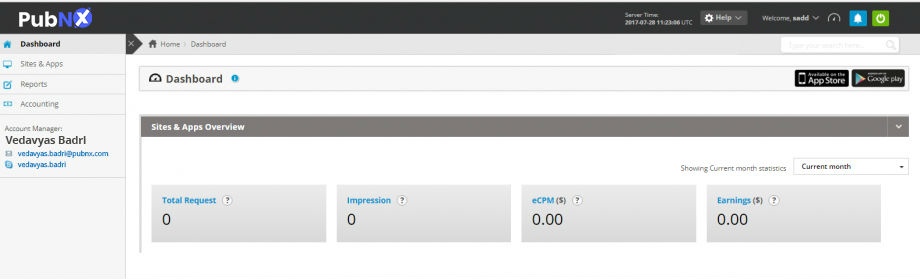
Sites & Apps Overview shows the statistics with the help of the drop-down list box. The drop-down list box will display the statistics for Today,Yesterday, Last 7 days, Current Monthand Last Month.
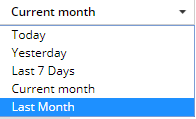 Note
Note
: by default the statistics of current date will display.
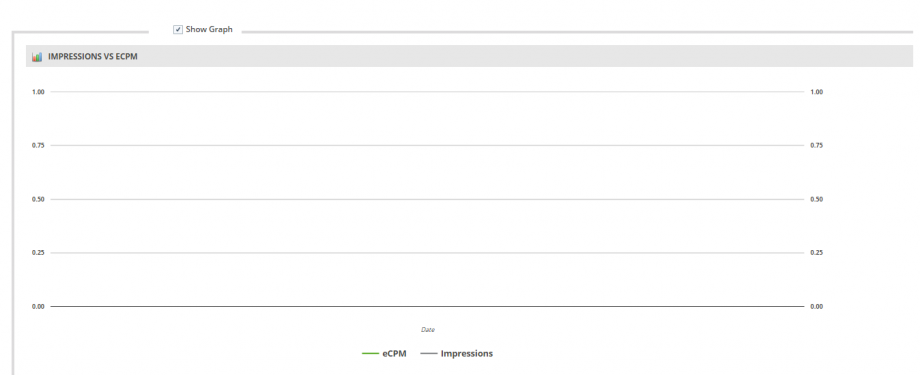
The publisher can view data for the last month by selecting the Show Graph check box.
The publisher can also view the data for the current month in a tabular format.
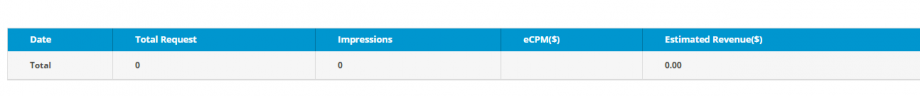
Following table describes the Site and App details:
| Parameters | Description |
|
Date |
Displays the site and app Date for the current month. |
| Impressions |
Displays the Impression details for the current month. |
|
eCPM |
Displays the eCPM value for the current month. |
|
Estimated Revenue |
Displays the estimated revenue for the current month. |